What Is the Demographic Trajectory in the India Population History Timeline?
India's demographic history is the century-long transition from high mortality and recurring famines in 1921 to a modern sub-replacement total fertility rate of 2.0 in 2021, according to the Ministry of Health and Family Welfare. This shift transformed India from a British colony into the world's most populous nation in April 2023.
Key Takeaways
- India's population contracted in 1921 before entering a century of unbroken growth.
- Total fertility fell to 2.0 in 2021, dropping below the replacement level.
- India surpassed China in April 2023 with 1.428 billion people.
- A working-age share of 67% creates a growth window until the 2040s.
Many observers assume India faces an endless population explosion driven by runaway birth rates. The demographic data shows the opposite reality. Birth rates across the country have plummeted over the past thirty years, dropping below the replacement threshold of 2.1 children per woman. Tracing the India population history timeline reveals that population growth today stems from demographic momentum, not excessive fertility. Millions of young citizens born decades ago are simply living longer, healthier lives. Examining these critical turning points helps students, educators, and researchers understand how India arrived at this pivotal demographic stage.
Why Is 1921 the Great Divide in the India Population History Timeline?
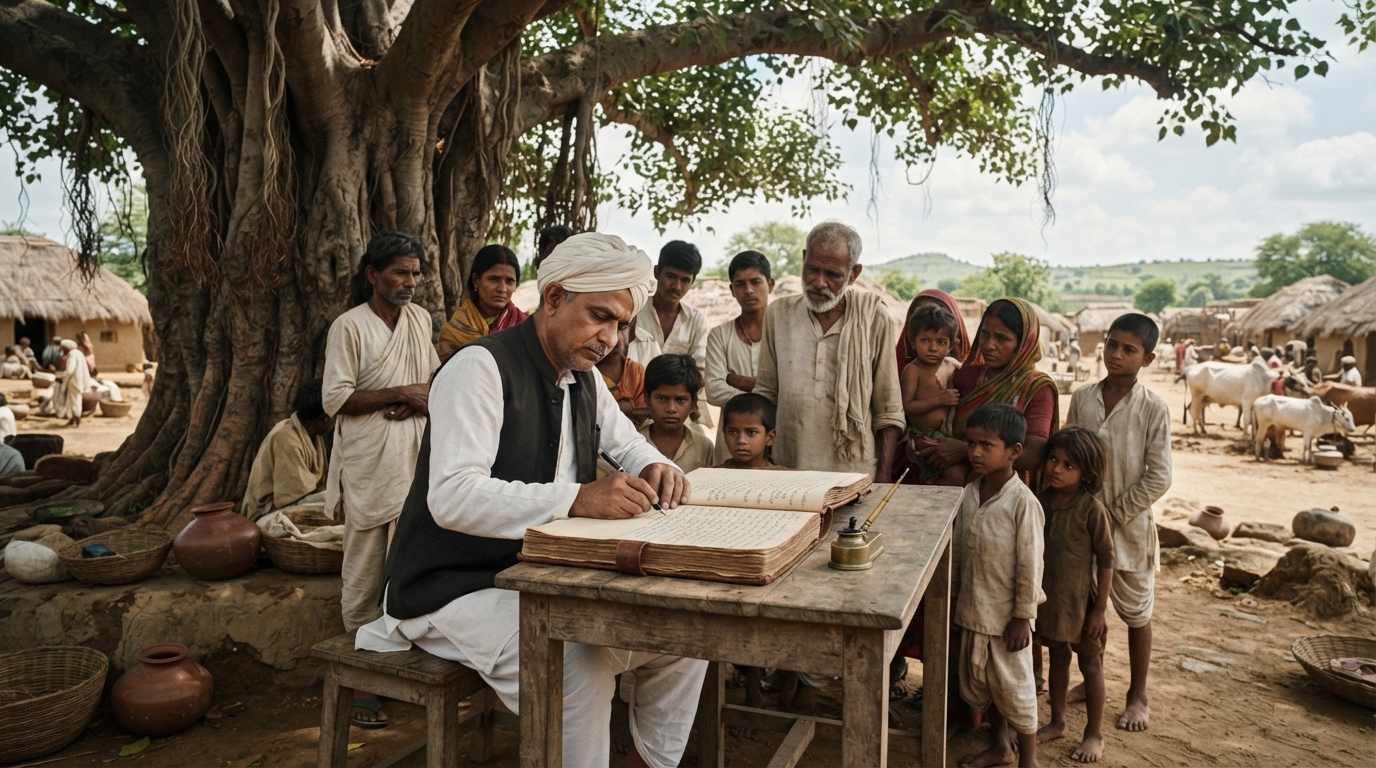
The 1921 Census marks the Great Divide because it recorded India's last decadal population decline of 0.03%. Before 1921, recurring famines and epidemics caused severe mortality spikes. After 1921, improvements in basic sanitation, food transport, and disease management established continuous, accelerating population growth across the subcontinent.
1891–1921: High Births, High Deaths (Fluctuating Population)
│
▼
1921: "The Great Divide" (-0.03% Growth, 1918 Influenza)
│
▼
1921–1951: Steady Mortality Decline (Initial Growth Phase)
│
▼
1951–1991: Rapid Expansion (Post-Independence Health Gains)
The 1918 Influenza Epidemic and Famine Shocks
Prior to 1921, India lived in a high-mortality, high-fertility demographic trap. Birth rates remained high, but death rates fluctuated wildly whenever drought or disease struck. The 1918 influenza epidemic killed an estimated 12 to 17 million people across British India. This catastrophic outbreak collided with severe harvest failures in 1918 and 1920.
As a result, the Census of 1921 recorded a population drop from 252 million in 1911 to 251.3 million [Census of India, 1921]. This 0.03% decline represents the only negative growth decade in modern Indian census records. Living conditions across agrarian provinces remained fragile, with life expectancy hovering around 20 years.
The Shift from High Mortality to High Growth
After 1921, the demographic dynamic decoupled mortality from extreme environmental shocks. Colonial administrative responses improved grain distribution along newly expanded railway networks. Basic public health measures reduced cholera and plague outbreaks in major urban centers.
Death rates began a permanent decline, falling from over 40 deaths per thousand to under 30 within three decades. Birth rates did not drop at the same speed. This widening gap between falling death rates and steady birth rates initiated modern India's demographic transition.
How Did Post-Independence Policies Reshape India's Population Growth?
Post-independence population policies evolved from clinical distribution models in 1951 to coercive state targets during the mid-1970s, before adopting rights-based reproductive healthcare in 1994. These structural policy shifts altered how Indian families planned their households and redefined public healthcare delivery across rural and urban districts.
The 1951 Census and Early Five-Year Planning
India became the first developing country to launch an official state-sponsored family planning program in 1952. The first post-independence Census in 1951 recorded 361.1 million citizens [Census of India, 1951]. Early planners viewed population growth as a direct obstacle to economic development and food security.
The First and Second Five-Year Plans established rural family welfare clinics to distribute barrier contraceptives. These early programs lacked ground infrastructure and produced minimal reductions in birth rates. For a deeper look at early state planning, see our guide on economic milestones in Indian history.
1952: National Family Planning Program Launched
   │
   ▼
1976: Emergency-Era Nasbandi Quotas (8.3M Sterilizations)
   │
   ▼
1994: Cairo ICPD Shift (Target-Free, Rights-Based Healthcare)
   │
   ▼
2000: National Population Policy (Focus on Education & Maternal Care)
The 1976 Emergency and Coercive Sterilization Targets
Population policy shifted from voluntary guidance to authoritarian coercion during the Emergency from 1975 to 1977. Sanjay Gandhi introduced aggressive sterilization quotas for state bureaucrats, schoolteachers, and police officers. Over 8.3 million sterilizations took place in 1976 alone, primarily targeting low-income men for vasectomies [Ministry of Health and Family Welfare Historical Records, 1977].
This heavy-handed campaign created intense public backlash and deep distrust toward state family planning programs. As a direct consequence, subsequent governments abandoned male sterilization programs entirely. The burden of modern surgical contraception shifted onto female tubectomy, which still accounts for more than 67% of modern contraceptive use in India.
How Did the 1994 Cairo Conference Establish the Target-Free Approach?
The target-free approach is a rights-based reproductive healthcare policy adopted by India in 1996 following the 1994 International Conference on Population and Development (ICPD) in Cairo. According to the Ministry of Health and Family Welfare, this framework formally abolished centralized sterilization quotas in favor of voluntary family planning, maternal survival, and decentralized community healthcare.
This strategy prioritized maternal survival, infant immunization, and female education over raw surgical quotas. Poonam Muttreja, Executive Director of the Population Foundation of India, observed that sustained fertility declines occurred precisely because policy focused on female literacy and healthcare access rather than coercion.
Why Did India's Fertility Rate Drop Below the Replacement Level?
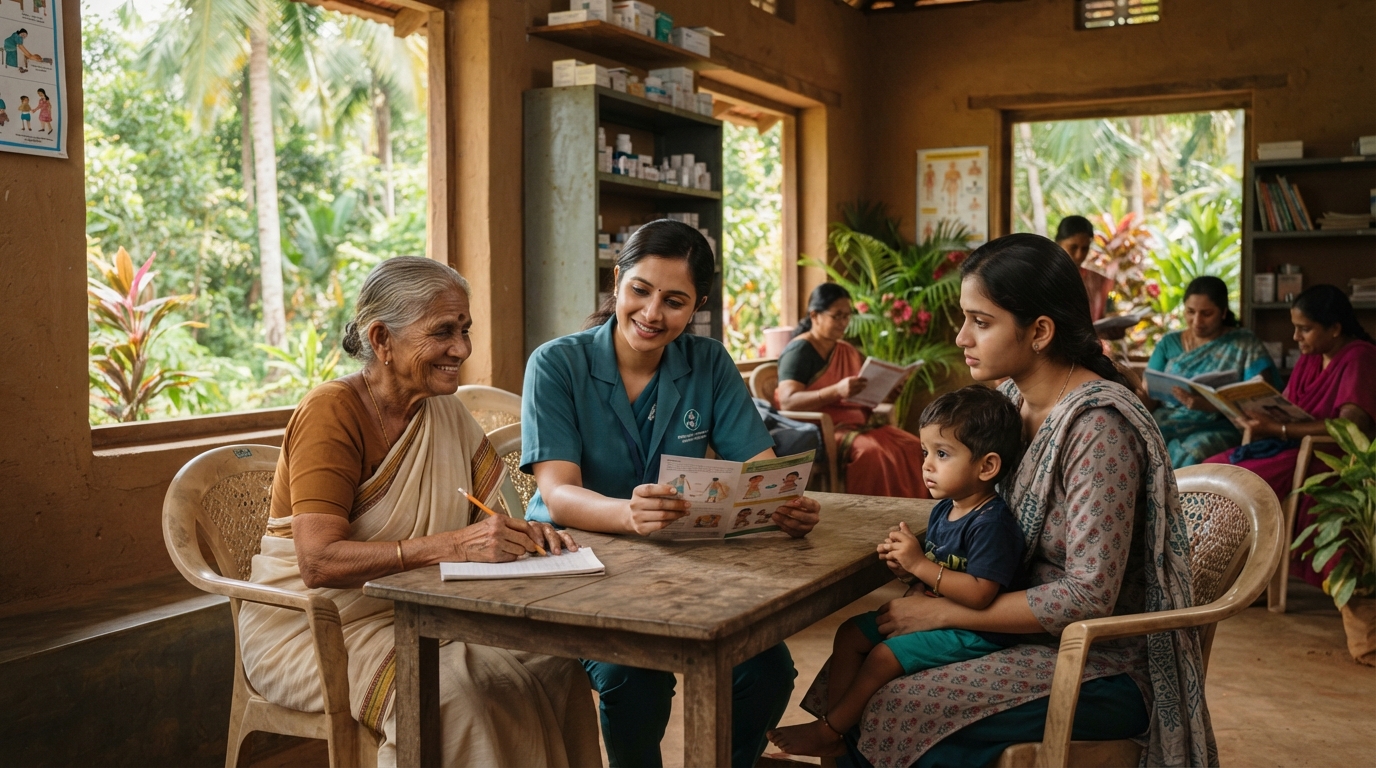
India's sub-replacement fertility is the demographic milestone where the national Total Fertility Rate dropped to 2.0 children per woman, according to the National Family Health Survey (NFHS-5, 2019–2021). This transition below the 2.1 replacement threshold occurred because expanded female schooling, urbanization, and accessible contraception led families across thirty-one states to choose smaller households.
1992–1993 (NFHS-1): 3.4 TFR ──────┐
                                   │
2005–2006 (NFHS-3): 2.7 TFR ──────┼──► Dropped Below Replacement (2.1)
                                   │
2019–2021 (NFHS-5): 2.0 TFR ──────┘
NFHS-5 Data and the 2.0 Fertility Milestone
The release of the fifth National Family Health Survey (NFHS-5, 2019–2021) confirmed that India's Total Fertility Rate (TFR) fell to 2.0 [NFHS-5 / Ministry of Health and Family Welfare, 2021]. This marked a steep decline from 3.4 in 1992–1993 and 2.7 in 2005–2006.
Replacement-level fertility is 2.1 children per woman. When a country drops below 2.1, its population will eventually contract once demographic momentum concludes. Out of 36 states and union territories surveyed in NFHS-5, 31 recorded fertility rates at or below replacement level. The national India population history timeline shows that voluntary family planning has succeeded across diverse cultural regions.
Female Education and Public Health Gains
Female schooling represents the strongest statistical predictor of lower fertility rates across Indian districts. Data from NFHS-5 indicates that women with twelve or more years of schooling have an average TFR of 1.78, compared to 2.82 for women with no schooling.
Education Level vs. Total Fertility Rate (NFHS-5)
┌──────────────────────────────┬────────┐
│ No Schooling                 │ 2.82   │
│ < 5 Years Schooling          │ 2.36   │
│ 5–9 Years Schooling          │ 2.09   │
│ 10–11 Years Schooling        │ 1.89   │
│ 12+ Years Schooling          │ 1.78   │
└──────────────────────────────┴────────┘
Improved child survival rates also gave parents confidence that fewer births were necessary to secure a family's future. Life expectancy rose from 32 years in 1947 to over 70 years by 2020. Better public sanitation and maternal clinics altered traditional family structures far more effectively than state mandates. You can review how medical infrastructure expanded across generations in our index on 1,000 years of Indian medical history.
Demographic Momentum and the Working-Age Window
India's total population continues to expand even with a fertility rate of 2.0 due to demographic momentum. John Wilmoth, former Director of the UN Population Division, emphasized that populations with a young age structure grow because large cohorts of children enter their reproductive years simultaneously.
India currently enjoys a working-age majority. Approximately 67% of India's population falls between the ages of 15 and 64 [UNFPA, 2023]. This demographic dividend provides an economic advantage that will peak around the late 2030s before dependency ratios begin to climb.
How Does Regional Divergence Affect India's Population Timeline?
Regional divergence divides India into an aging south and a young north. Southern states completed their demographic transition decades ago, while northern states are only now approaching replacement fertility. This geographical gap creates economic differences, labor migration corridors, and disputes over parliamentary seat allocation across state borders.
Why Is There a Four-Decade Timeline Gap Between Kerala and Bihar?
The four-decade demographic timeline gap is the regional divergence between early-transition southern states and late-transition northern states across India. According to the National Family Health Survey (NFHS-5), Kerala achieved replacement-level fertility of 2.1 in 1988 through universal female education and healthcare access, whereas Bihar recorded a Total Fertility Rate of 3.0 in 2021.
Tamil Nadu followed Kerala shortly after in the early 1990s. In contrast, Uttar Pradesh stood at a Total Fertility Rate of 2.4 in 2021 alongside Bihar's 3.0. Kerala already faces an aging population with closing primary schools and high elderly dependency ratios. Bihar and Uttar Pradesh will continue adding young workers to the national labor force for another two decades.
Regional Demographic Divide (TFR Comparison)
┌─────────────────┬──────────┬──────────────────────────────┐
│ State           │ NFHS-5   │ Replacement Status (2.1)     │
│                 │ TFR      │                              │
├─────────────────┼──────────┼──────────────────────────────┤
│ Sikkim          │ 1.1      │ Far Below Replacement        │
│ Kerala          │ 1.8      │ Below (Achieved in 1988)     │
│ Tamil Nadu      │ 1.8      │ Below (Achieved in 1990s)    │
│ Maharashtra     │ 1.7      │ Below Replacement            │
│ West Bengal     │ 1.6      │ Below Replacement            │
│ Uttar Pradesh   │ 2.4      │ Above Replacement            │
│ Bihar           │ 3.0      │ Above Replacement            │
└─────────────────┴──────────┴──────────────────────────────┘
Key Milestones Across India's Demographic Eras
The table below outlines the core demographic benchmarks that defined each major era in modern Indian history.
| Year / Period | Total Population | Key Metric or Event | Primary Demographic Driver |
|---|---|---|---|
| 1911–1921 | 251.3 million | -0.03% decadal growth (Great Divide) | 1918 influenza epidemic and famines [Census 1921] |
| 1951 | 361.1 million | 1.25% annual growth rate | Post-independence public health investments [Census 1951] |
| 1976 | ~630 million | 8.3 million sterilizations | Forced sterilization campaign during Emergency [MoHFW, 1977] |
| 1988 | ~820 million | Kerala reaches replacement TFR (2.1) | Female literacy and rural primary healthcare [NFHS-5] |
| 1994 | ~920 million | Cairo ICPD adoption | Transition to target-free reproductive health [ICPD, 1994] |
| 2021 | ~1.40 billion | National TFR drops to 2.0 | Expanded female schooling and contraception [NFHS-5] |
| 2023 | 1.428 billion | India surpasses China as most populous | Demographic momentum and fertility decline [UN DESA, 2023] |
The Delimitation Debate and Political Representation
The gap between northern and southern fertility rates has triggered a major political dispute regarding the delimitation of parliamentary seats. Article 82 of the Indian Constitution mandates the redrawing of Lok Sabha constituencies based on updated census counts. A freeze on seat allocation instituted in 1976 was extended through 2026 to prevent penalizing southern states for successful family planning.
If parliamentary seats are redistributed strictly by population after the next census, northern states could gain dozens of seats while southern representation declines. This dilemma underscores how the India population history timeline intersects with federal politics and constitutional governance. For context on other nation-defining political milestones, read our breakdown of historic dates in modern India.
When Will India's Population Peak and Begin to Decline?
United Nations projections indicate India's population will peak at approximately 1.7 billion people around the year 2064. After reaching this ceiling, the population will begin a gradual contraction driven by sustained sub-replacement fertility rates, increasing elderly dependency, and shrinking youth cohorts across all major states.
Projected Population Trajectory (UN World Population Prospects 2024)
  1.7B ────────────────────────────── Peak c. 2064 (~1.70 Billion)
                                     ╱      ╲
  1.5B ───────────── 2023 Crossover ╱        ╲
                    (1.428 Billion)╱          ╲
  1.3B ───────────┐               ╱            ╲
                  │              ╱              ▼
  1.0B ───────────┴─────────────┴─────────────────────
                2000           2023   2064     2100
How Did India Overtake China in Population in April 2023?
India's demographic overtaking of China is the global population milestone reached in late April 2023 when India's population hit 1.428 billion citizens. According to the United Nations Department of Economic and Social Affairs (UN DESA), India surpassed China because China's fertility rate collapsed to approximately 1.0, while India's youthful age structure sustained positive demographic momentum.
India's population continued to expand due to India's youthful base. This transition was recorded as a key date for global demographics. Historical dates of this magnitude often coincide with other major milestones documented in our archive of late April in Indian history.
The Projected 2064 Peak and Aging Transition
According to the UN World Population Prospects (2024 revision), India will add roughly 250 million more citizens before peaking in 2064 [UN World Population Prospects, 2024]. By 2050, more than 20% of India's population will be over 60 years old.
This demographic aging will shift national spending priorities from building schools to funding geriatric healthcare, universal pensions, and elderly social safety nets. State planners face a thirty-year window to invest in vocational training, manufacturing jobs, and female workforce participation while the working-age ratio remains high. Tracking daily historical records on platforms like today in history India contextualizes how rapidly these demographic shifts unfold over time.
Frequently Asked Questions
Q: Why is 1921 called the Year of the Great Divide?
The 1921 Census was the last time India's population experienced a negative decadal growth rate (-0.03%), dropping to 251.3 million due to the 1918 influenza epidemic and famines. After 1921, improved public health and grain transport ensured unbroken population growth.
Q: What is India's current Total Fertility Rate?
According to NFHS-5 data released by the Ministry of Health and Family Welfare, India's Total Fertility Rate stands at 2.0 children per woman. This figure sits below the standard replacement rate of 2.1, meaning average family sizes are shrinking across most Indian states.
Q: When did India officially surpass China in population?
United Nations demographic data confirmed that India surpassed China in late April 2023, reaching an estimated population of 1.428 billion people. China entered an earlier population contraction due to low fertility, while India's youthful age structure maintained growth.
Q: When is India's population expected to peak?
Projections from the United Nations World Population Prospects (2024) estimate that India's population will peak at approximately 1.7 billion around the year 2064. Following this peak, the population will begin a slow, steady demographic contraction.
Your Next Move
If you are building an educational curriculum or research paper on Indian demographics, focus your analysis on regional fertility divergence rather than national averages. Compare state-level NFHS-5 metrics between southern states like Kerala and northern states like Bihar to demonstrate how public health investments drove varied outcomes across the India population history timeline. Check our daily archive on today history in India to connect these broad demographic milestones with specific historical dates.
Related Reading
- India at the Olympics: A Timeline of Historic Sporting Milestones
- Indian History Timeline Chart: Key Milestones (Digital Reference)
- Indian History Milestones: The Maurya and Gupta Empires
- The 1971 India-Pakistan War: Key Dates and Historical Summary
Sources
- National Family Health Survey (NFHS-5), 2019-21: India Report — Ministry of Health and Family Welfare & International Institute for Population Sciences, 2021. Supports: India's Total Fertility Rate falling to 2.0 children per woman, state-level fertility divergence (such as Bihar at 3.0), and fertility breakdown by maternal educational attainment.
- UN DESA Policy Brief No. 153: India Overtakes China as the World's Most Populous Country — United Nations Department of Economic and Social Affairs, 2023. Supports: India surpassing China to become the world's most populous nation in late April 2023 with an estimated population of 1.428 billion.
- World Population Prospects 2024: Summary of Results — United Nations Department of Economic and Social Affairs, 2024. Supports: Projections that India's population will peak at approximately 1.7 billion around 2064 before entering a long-term demographic contraction.
- State of World Population 2023: 8 Billion Lives, Infinite Possibilities — United Nations Population Fund, 2023. Supports: India's age structure and demographic dividend window where approximately 67% of the population is of working age (15–64).
- Census of India 1921: General Report and Tables — Office of the Registrar General & Census Commissioner, India, 1923. Supports: The 1921 Census marking the "Great Divide" with a decadal population contraction of 0.03% to 251.3 million following the 1918 influenza pandemic and harvest failures.
- Census of India 1951: General Population Tables — Office of the Registrar General & Census Commissioner, India, 1951. Supports: The first official post-independence Census enumeration recording 361.1 million citizens in 1951.
- Programme of Action of the International Conference on Population and Development — United Nations Population Fund, 1994. Supports: The 1994 Cairo ICPD shift establishing voluntary, rights-based reproductive healthcare that replaced coercive quotas with the target-free approach in India.